網格資料處理跟主要指的是遙測影像的處理,Python影像處理有許多方便的工具,而今天使用的Rasterio比較針對遙測影像的常見的方法。
大綱:
- Rasterio I/O
- 影像波段操作
Rasterio I/O
安裝Rasterio
conda install -c conda-forge rasterio
Rasterio主要功能是遙測影像的處理
讀取影像1
2import rasterio
src = rasterio.open("output/image.png")
基本資訊1
2
3print(src.width, src.height) # 長寬
print(src.crs) #crs
print(src.indexes)
回傳:600 300
None
(1, 2, 3, 4)
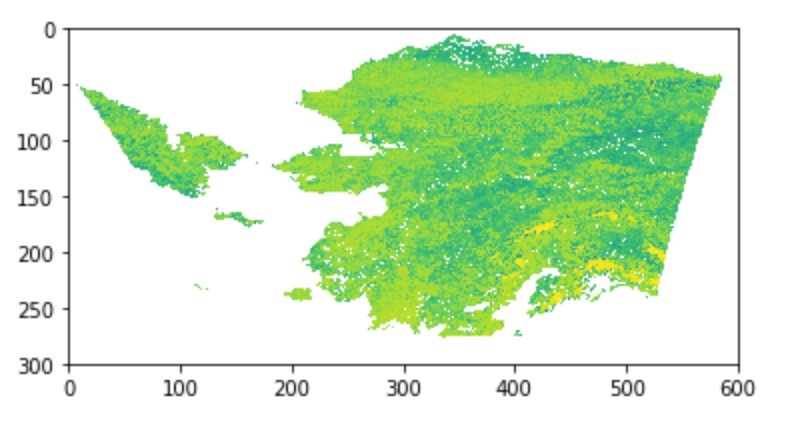
顯示影像1
2
3import matplotlib.pyplot as plt
from rasterio import plot
plot.show(src)
影像波段操作
遙測影像會有多個波段,波段間的運算或融合是常常需要的
顯示波段數量1
src.count
回應:4
顯示每個波段的型別1
src.dtypes
回應:('uint8', 'uint8', 'uint8', 'uint8')
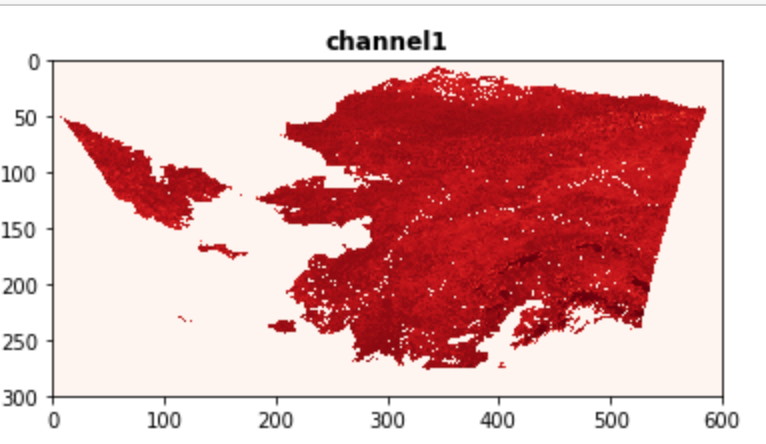
顯示單一波段的影像:1
plot.show((src, 1), cmap='Reds', title='channel1')
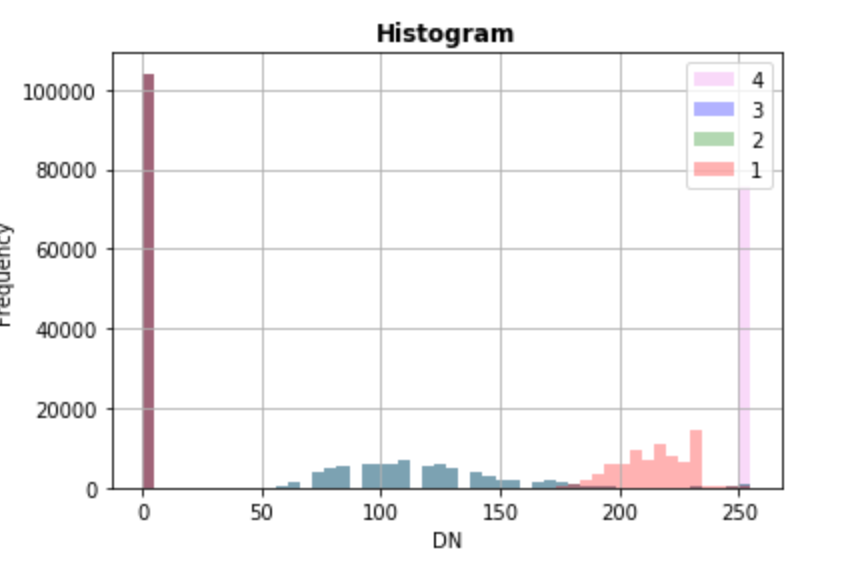
顯示波段的灰階統計資訊1
2plot.show_hist(src, bins=50, lw=0.0, stacked=False, alpha=0.3,
histtype='stepfilled', title="Histogram")
波段操作的的部分,使用numpy
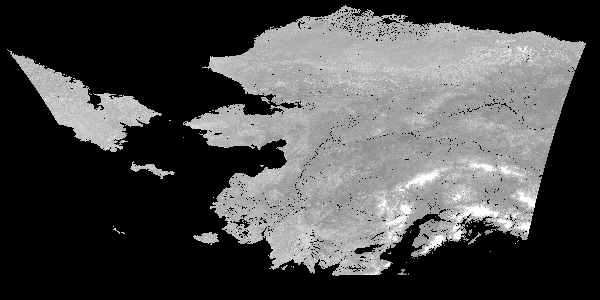
波段計算的範例,將影像波段融合(參考官網):1
2
3
4
5
6
7
8
9
10
11
12import numpy as np
b1,b2,b3,b4 = src.read()
total = np.zeros(b1.shape)
for band in b1, b2, b3,b4:
total += band
total /= 4
profile = src.profile
profile.update(dtype=rasterio.uint8, count=1, compress='lzw')
with rasterio.open('output/test-total.tif', 'w', **profile) as dst:
dst.write(total.astype(rasterio.uint8), 1)
後記
rasterio還有其他幾何資料操作的功能(例如·mask,polygonize等等),有興趣的人可以去官網看看喔