昨天我們已經整合了台鐵路線與對話的資料
今天就把圖畫完吧!
首先,
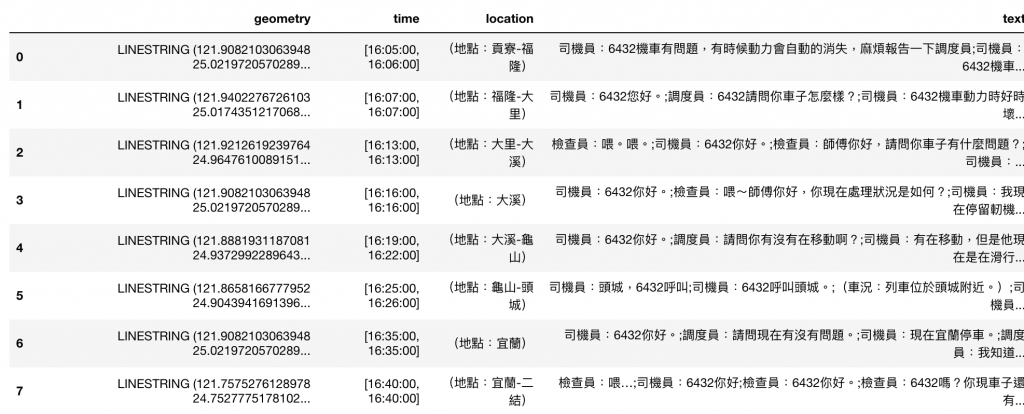
再次看看昨天的成果
1 | train_lines_talk |

有了這樣的資料,可以開始畫圖了
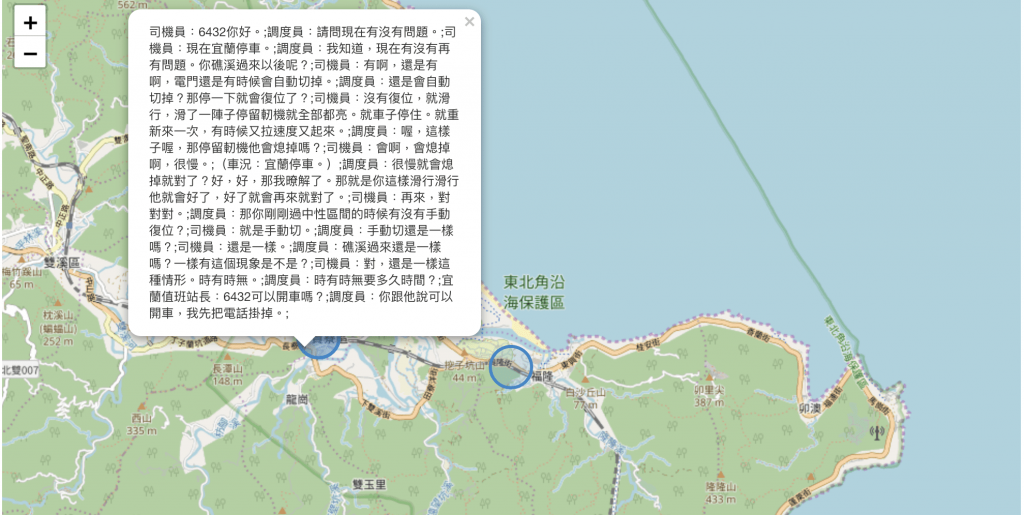
第一種畫法我們使用circlemarker
我們以點的方式來呈現資訊
1 |
|

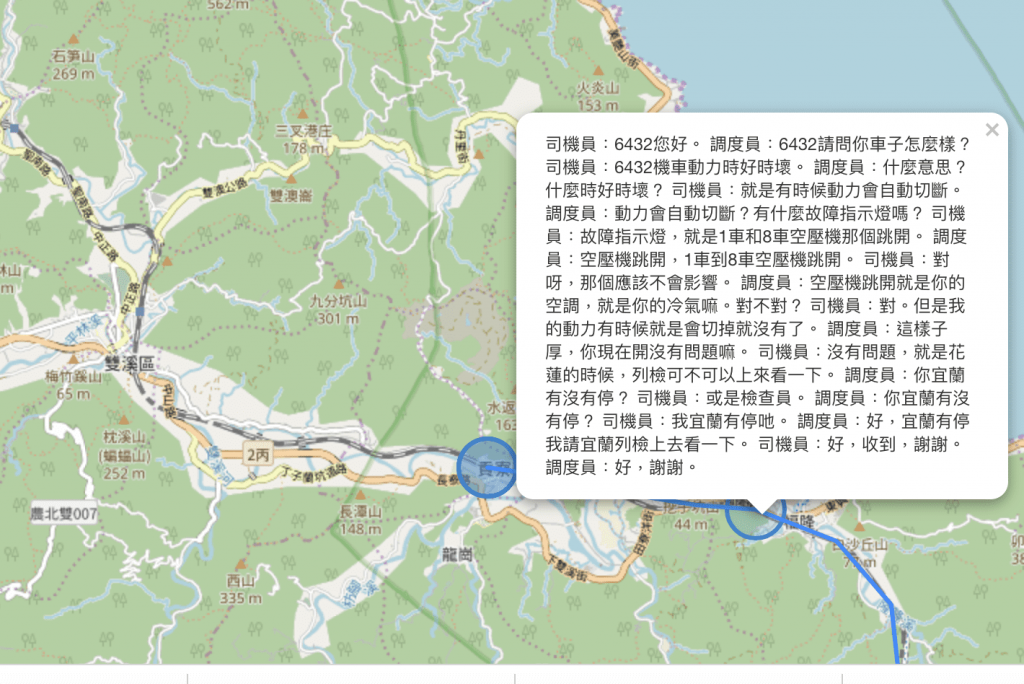
為了更清楚呈現資訊,把路線的資訊加進來1
2
3
4folium.GeoJson(
train_lines.to_json(),
name='geojson').add_to(m)
m

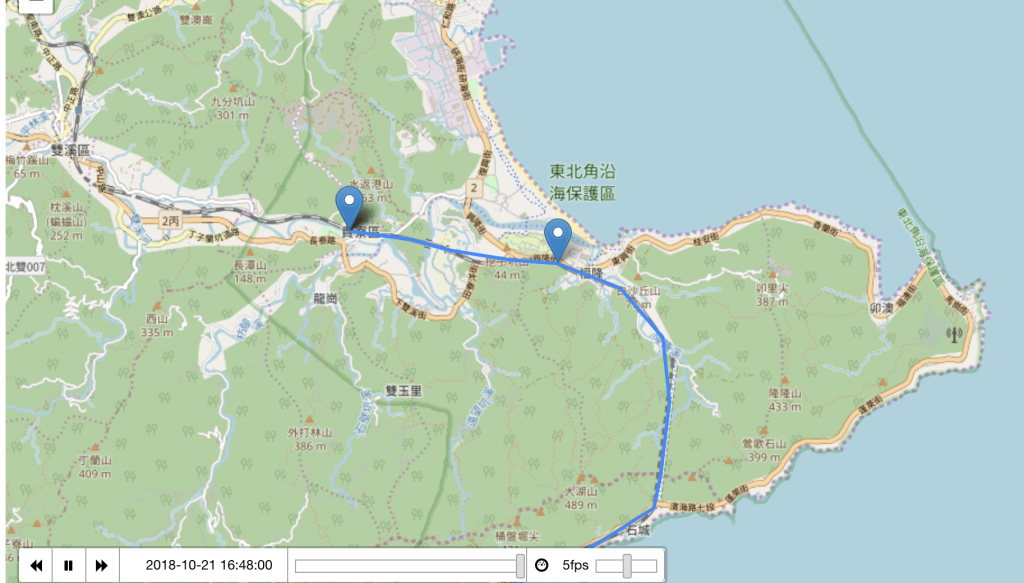
最後,我們試著把時間資料加進來
並使用TimestampedGeoJson這個外掛
要先把我們的資料整合成TimestampedGeoJson1
2
3
4
5
6
7
8
9
10
11
12
13
14
15
16features = [
{
'type': 'Feature',
'geometry': {
'type': 'Point',
'coordinates': list(row['geometry'].coords)[0],
},
'properties': {
'times': ['2018-10-21T'+row['time'][0],'2018-10-21T'+row['time'][1]],
'talk': row['text'],
'location':row['location'],
}
}
for idx,row in train_lines_talk.iterrows()
]
1 |
|

完成!