前言
今天延續昨天內插的議題,準備研究一下webGIS中的Contours(等高線)、Heatmaps(熱區圖)與Clustering(群聚圖)等方法,用來增進原本只是點資料的資訊呈現方式。
等高線(或等值線)
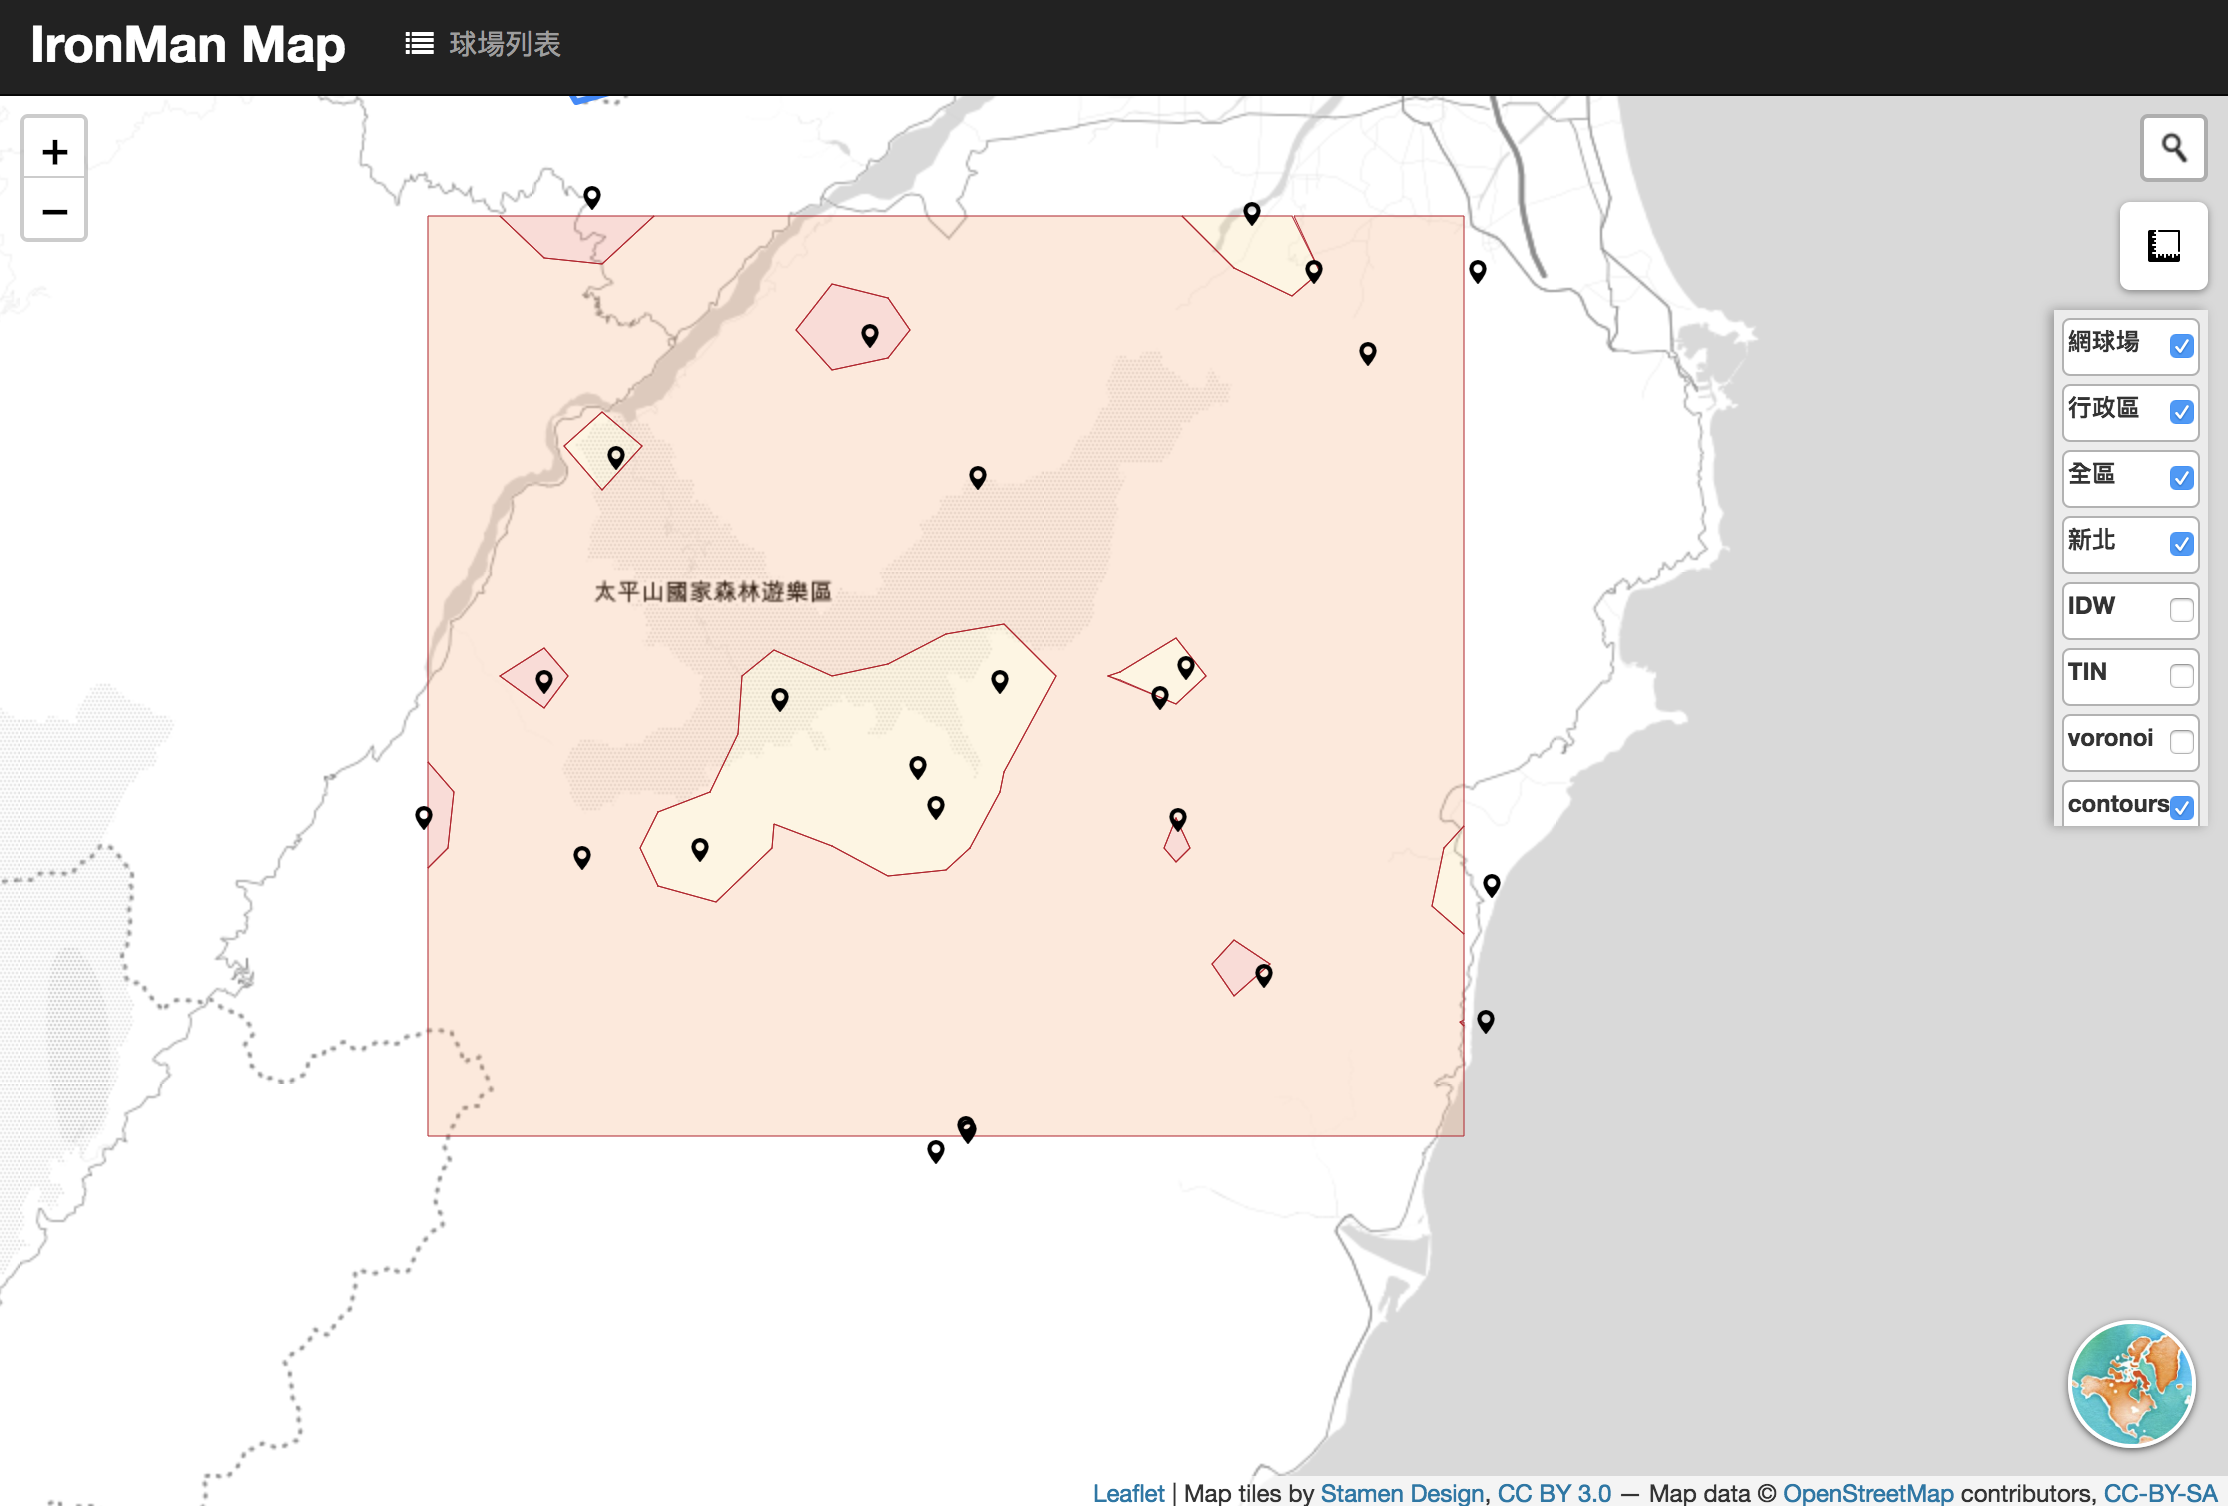
要算等高線(contours)或等值線我們可以使用turf.js的isobands,要產製一個等值線圖的流程是:1.離散的資料 2.內插(turf.js要使用規則的points) 3.使用isobands。
所以,延續昨天的IDW內插,我們內插一組gridType為points的資料後,想進一步將等值的範圍做整合,這個過程可以採用computer vision中的Marching squares。
這個方法主要需設定的東西是breaks,也就是要分值的斷點,例如0, 5, 10, 15, 20, 25, 30)。
turf.js計算等值線:1
2
3
4
5
6
7
8
9
10
11
12
13
14
15
16
17
18
19
20
21
22
23var contours_pts = turf.interpolate(ramdompts_ipl, 2, { gridType: 'points', property: 'obs', units: 'kilometers' });
//zProperty為要計算的欄位
var contours = turf.isobands(contours_pts, [0, 5, 10, 15, 20, 25, 30], { zProperty: 'obs' });
//結果為multiPolygon喔!!
//加入圖層
var contoursLayer = L.geoJson(contours, {
onEachFeature: function (feature, layer) {
layer.bindPopup(feature.properties.obs);
},
style: function (feature) {
return {
"fillColor": getColor(parseInt(feature.properties.obs.split('-')[0])),
"weight": 0.5,
"color": '#bd0026',
"opacity": 1,
}
}
}
).addTo(map);
成果:
HeatMaps
heatMap用來顯示資料群聚的現象,是根據核密度估計(kernel density estimation),演算法實作可以參考heatmap.js。
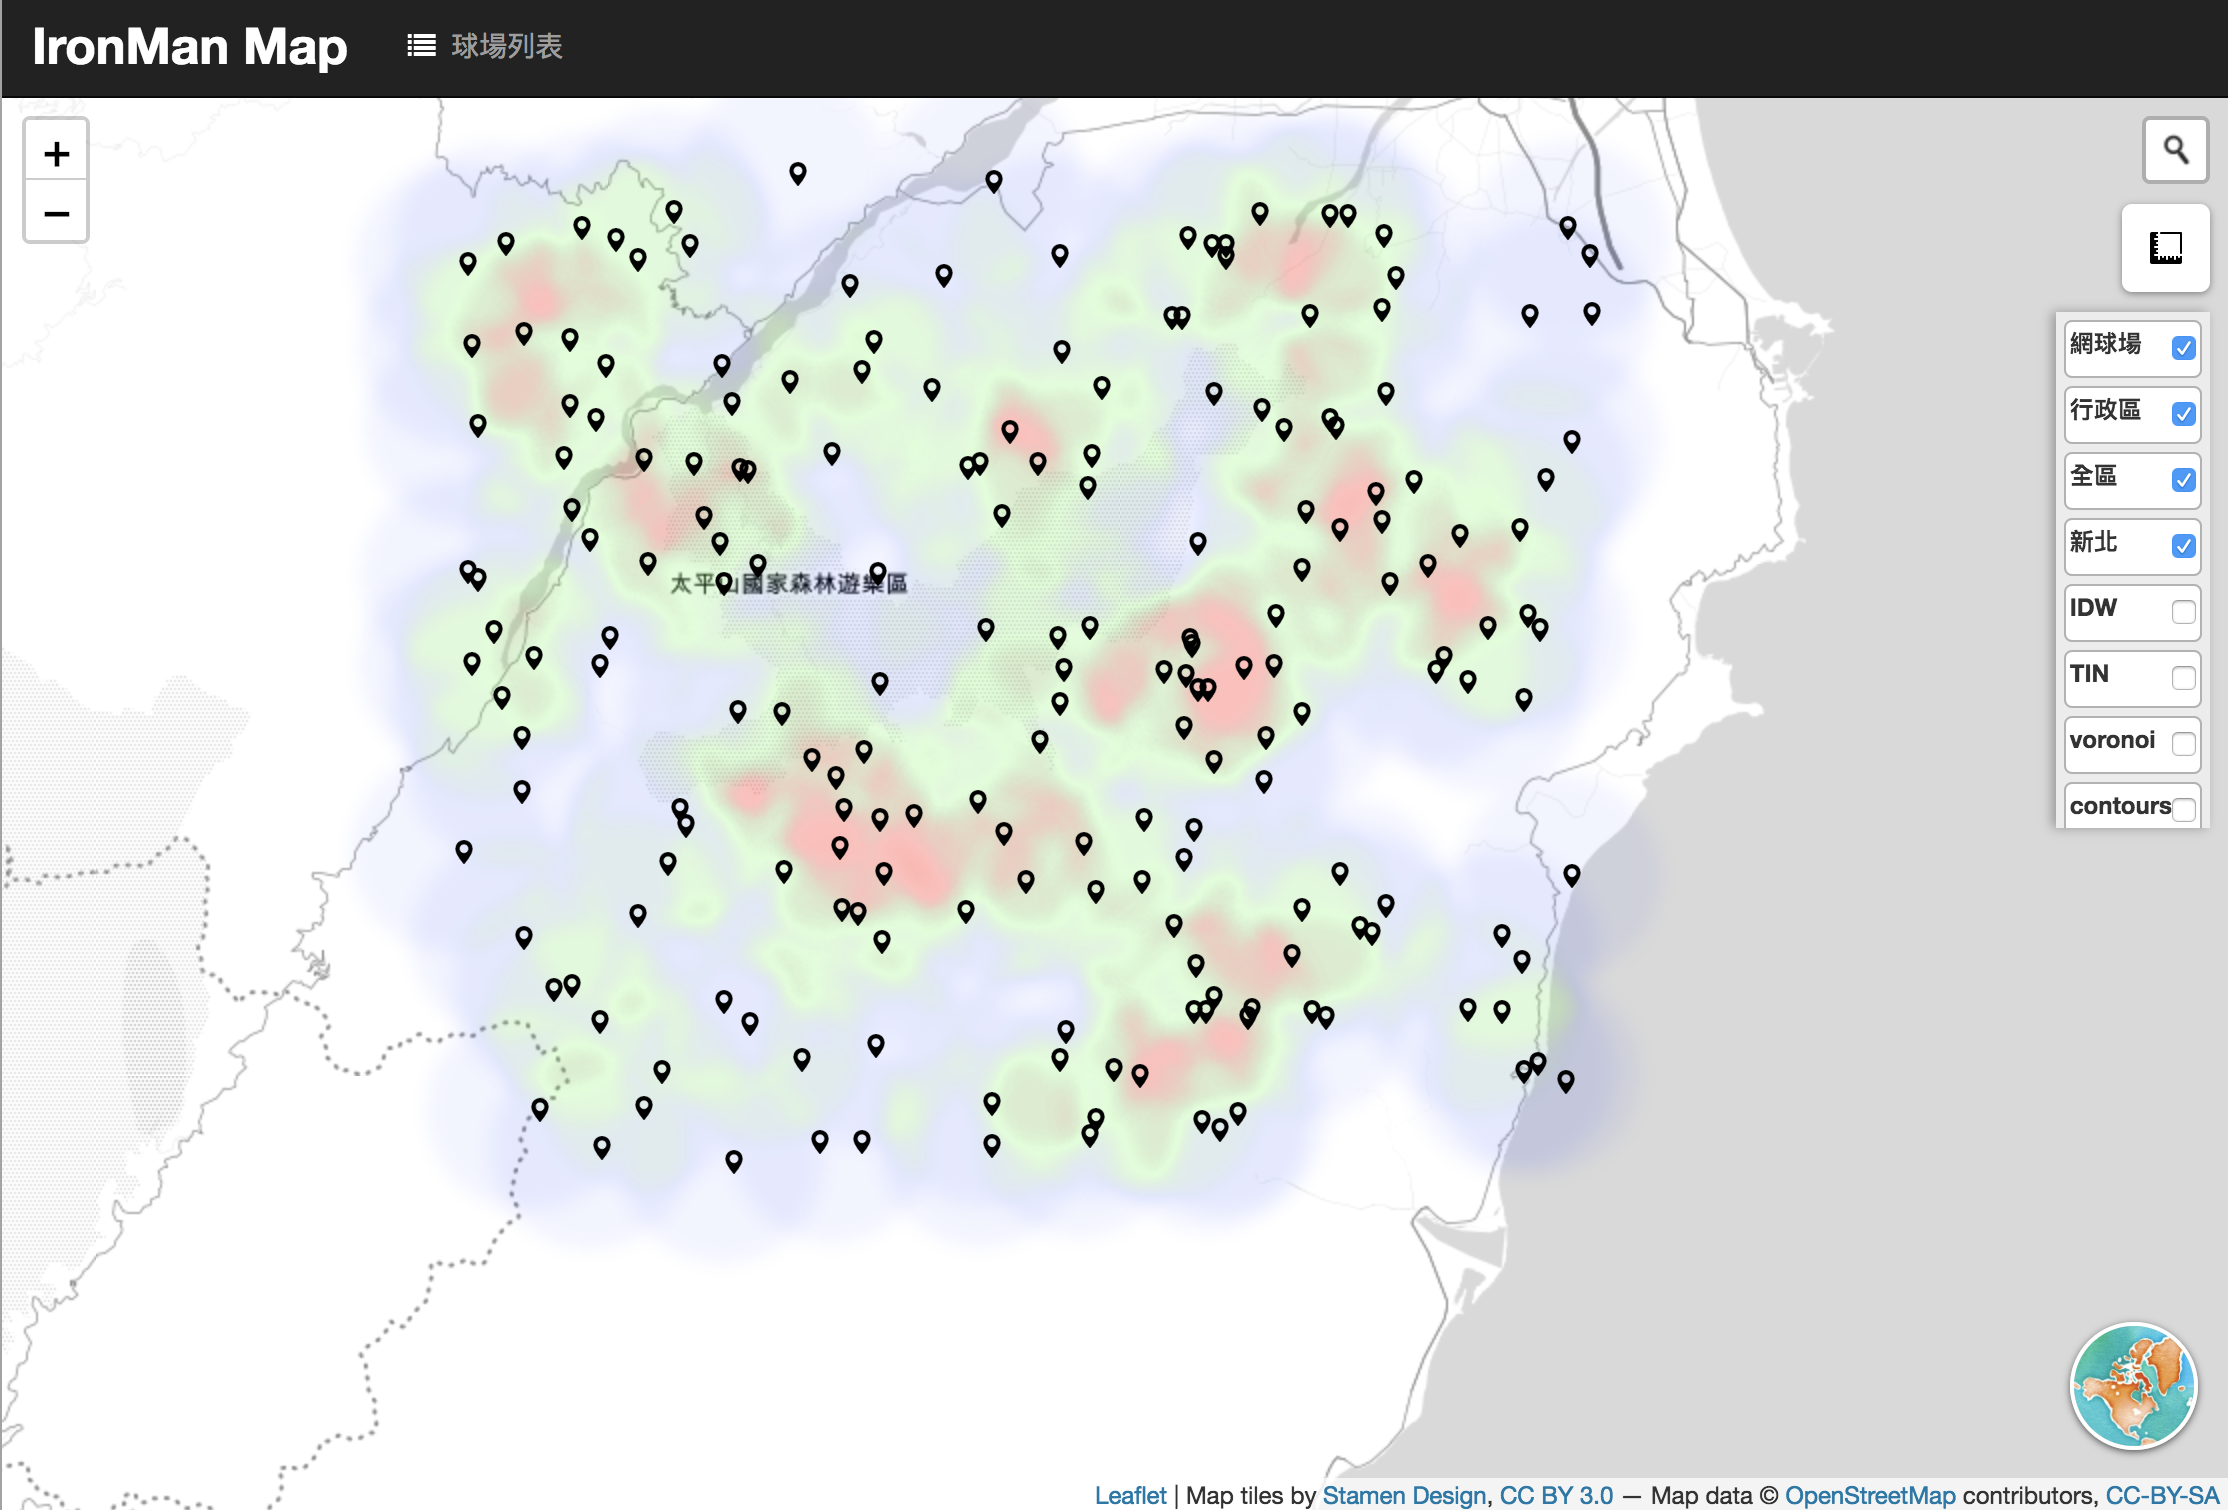
heatmap在Leaflet直接使用Leaflet.heat,heatmap使用時機與內插不同,heatmap是拿來看點資料的聚集現象,以核密度估計為基礎,包含了幾個參數包含每個點資料影響的半徑radius、設定色階的gradient以及用來設定平滑程度的高斯模糊參數blur等等,有興趣可以直接參考heatmap.js。
我們直接使用吧!1
2
3
4
5
6
7
8
9
10
11
12
13
14
15//組成資料放進去heatmapLayer
var arr = [];
turf.featureEach(ramdompts_ipl, function (feature) {
arr.push([feature.geometry.coordinates[1],
feature.geometry.coordinates[0],
feature.properties.obs,
]);
});
var heatmapLayer = L.heatLayer(arr, {
radius: 100,
minOpacity: 0,
blur: 0.75,
gradient: { 0.1: 'blue', 0.2: 'lime', 0.3: 'red' }
}).addTo(map);
成果:
從成果這邊可以看到,heatmap主要是從有資料的位置出發,超過影響範圍的地方則沒有值,因此heatmap適合用來表達影響力範圍的地理資訊。
Clustering
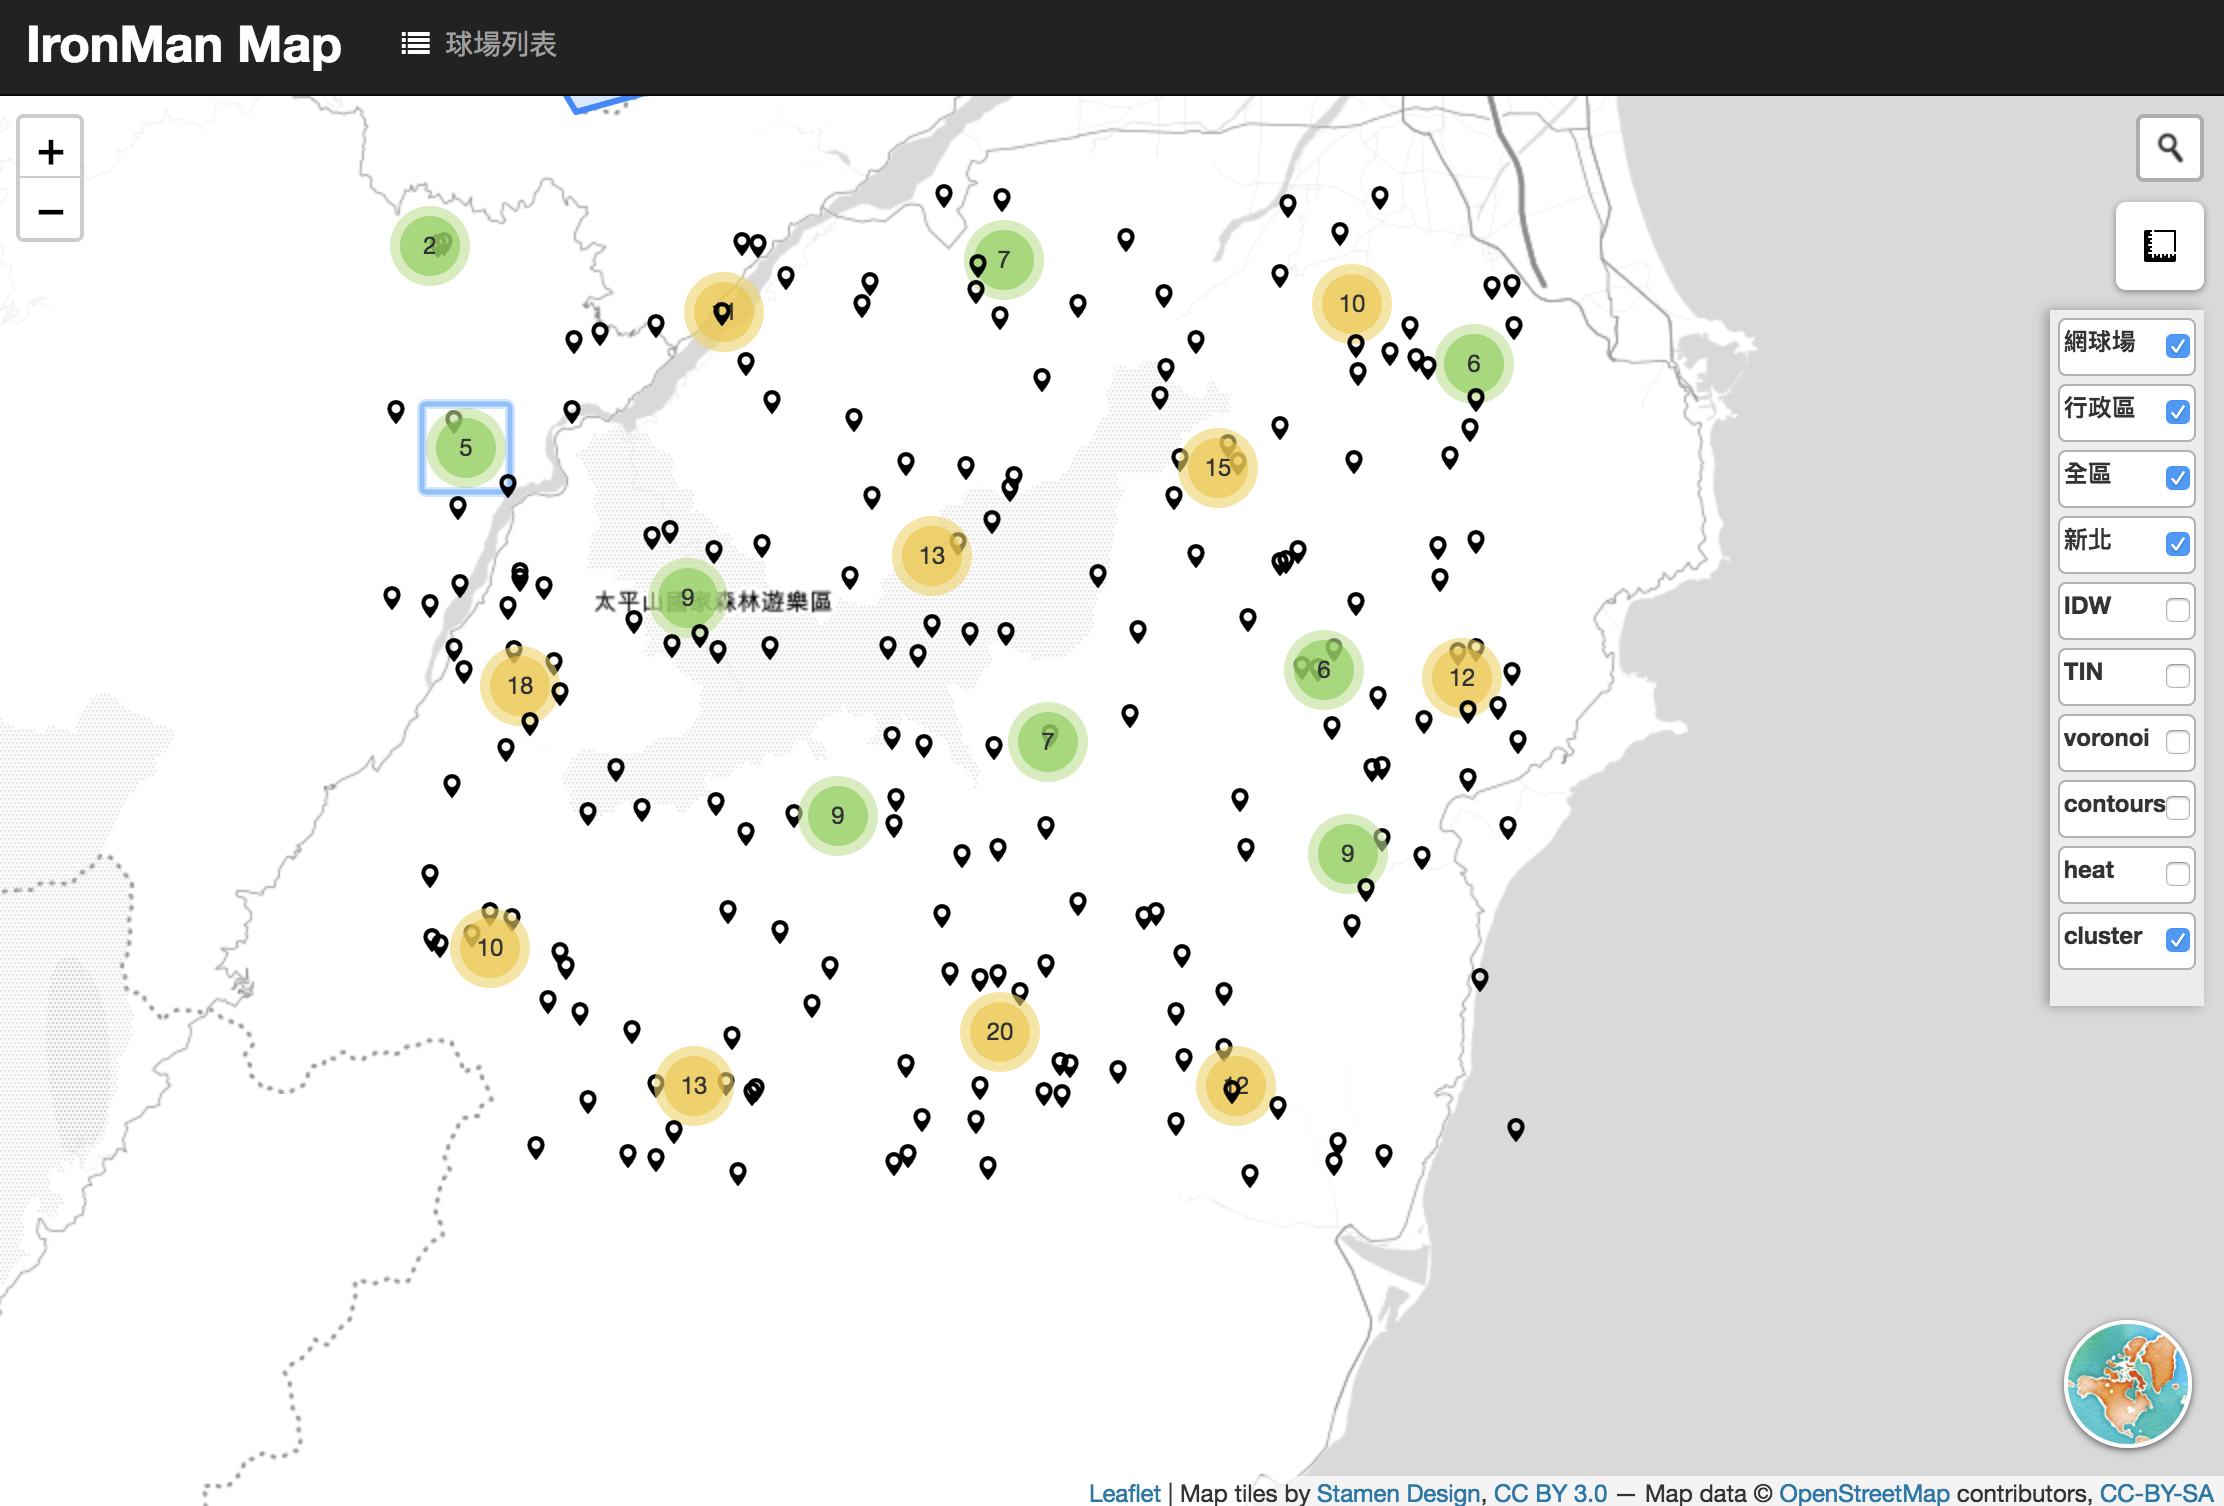
Points Clustering也是資料視覺化常見的手段,感覺起來跟前幾天提到的k-means群聚很像,目的是以若干個群聚中心點代表整體資料,讓資訊傳遞更清楚一些,避免一次大量離散的點資料呈現。
但是,與k-means不同的是,k-means需要預先說要給幾群,而這邊的Clustering是動態的,處理這個問題解決辦法是貪婪演算法(Greedy algorithms),請參考mapbox有完整說明!
我們引入Leaflet.markercluster然後直接使用:1
2var clusterLayer = L.markerClusterGroup();
clusterLayer.addLayer(ramdomLayer_ipl).addTo(map);
成果:
在Clustering的應用中Cluster是有階層的,不同的比例尺會有不同的聚合成果,類似的應用在房地產系統很常見喔!
後記
今天的程式碼一樣放在github(day20的commit)。